I Built a Live OSINT Dashboard. Here's What the Data Actually Shows You.
Seven free public APIs. One browser. No clearances required.
All layers active simultaneously — satellites, commercial flights, military aircraft, AIS maritime, GPS jamming, seismic
I finished the GPS jamming layer at around midnight. Toggled it on. Eastern Europe lit up.
I hadn't put that data there. I didn't make anything up. The API just showed me what was already happening — commercial aircraft GPS anomaly reports, aggregated in real time, mapping active electronic warfare zones from civilian aviation telemetry. It's always on. It's always updating. Nobody classifies it because technically it's just planes reporting navigation degradation.
That was the moment WorldView stopped being a coding project.
WorldView is a real-time geospatial intelligence dashboard running in a browser. Seven live data layers — commercial and military aviation, satellite orbital tracking, AIS maritime, GPS jamming, seismic events, NASA satellite imagery — fused onto an interactive 3D globe. All free public APIs. No authentication. Built by one person with Claude Code.
The technical breakdown is straightforward. The feeling of using it isn't.
What happens when you actually layer it
Each data source in isolation isn't impressive. Knowing where commercial planes are is just a flight tracker. AIS transponder data is a shipping logistics tool. Satellite orbital elements are published by NORAD and available to anyone.
But put them on the same globe, at the same time, and something changes.
I was testing the military aircraft layer one afternoon — a filter on the OpenSky ADS-B feed that strips commercial carriers and leaves the hex codes that don't resolve to published routes. Government contractors, NATO birds, surveillance platforms. I watched what the transponder data suggested was a submarine hunter do slow loops over the Baltic for forty-five minutes. I was tracking it from a desk chair.
Then I pulled up the GPS jamming overlay on the same view. The Middle East was lit up. It's almost always lit up.
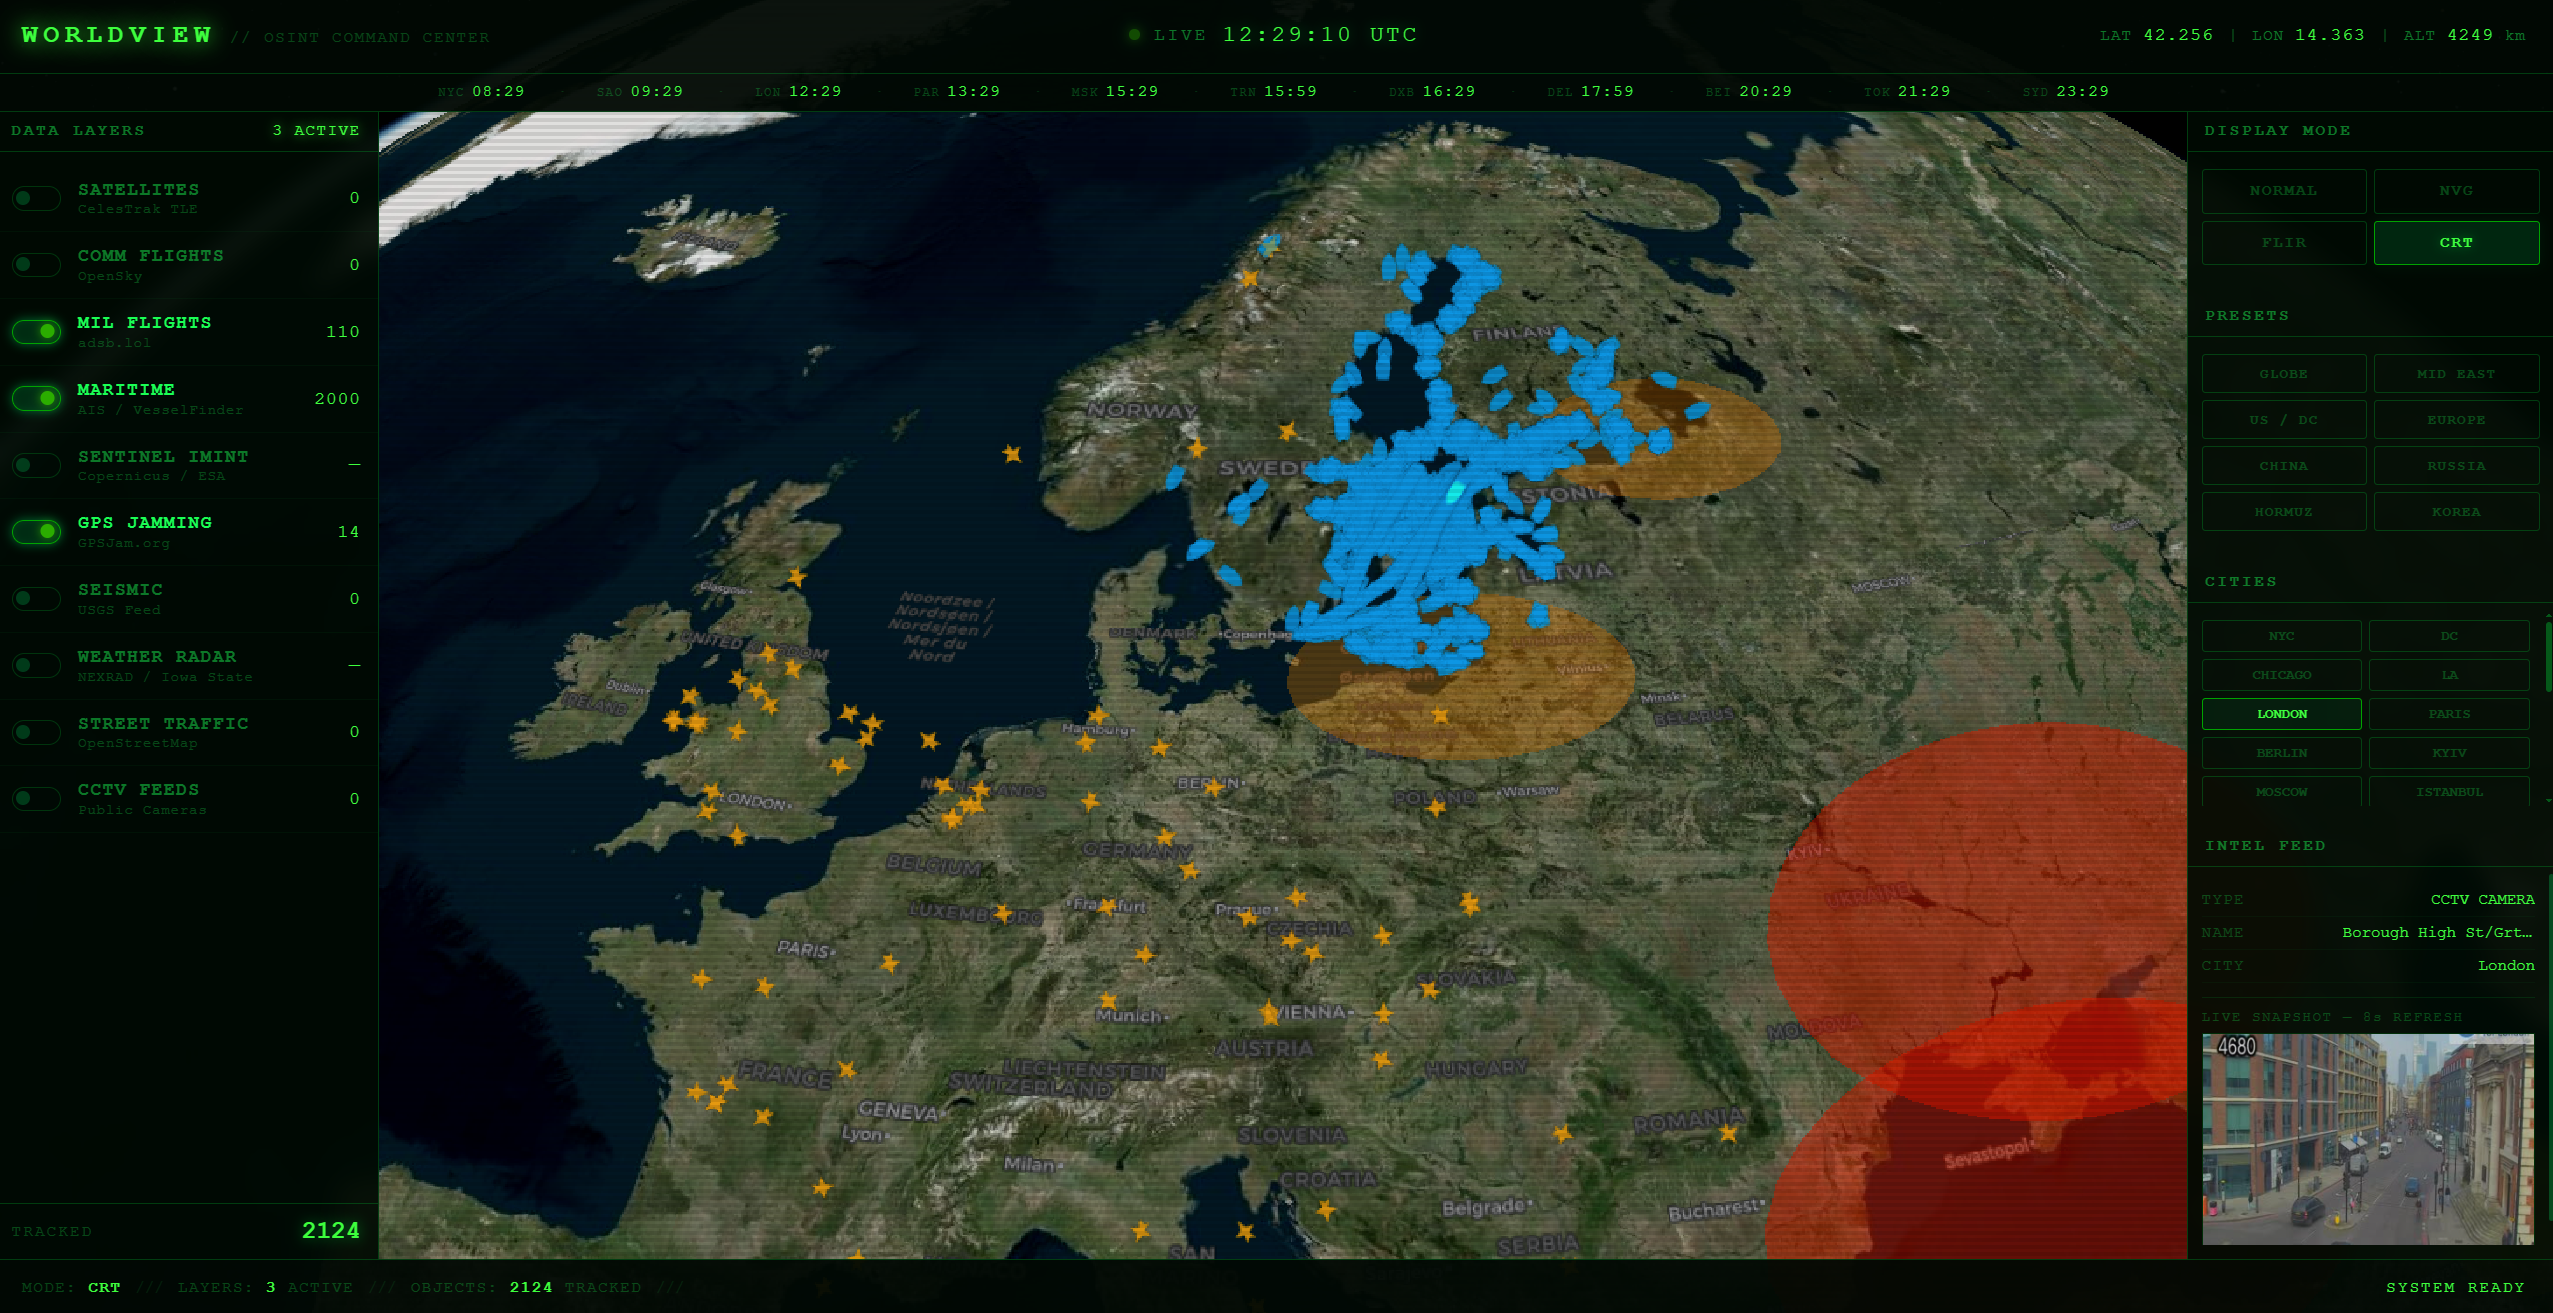
Baltic region — military aircraft (yellow), AIS maritime vessels (blue), GPS jamming zones (red/orange) bottom-right
At some point the gap between "this is a project" and "this is an actual intelligence tool" stops being visible.
The satellite layer is the one that takes a minute to process
Satellites don't broadcast positions. You calculate them.
TLE data — Two-Line Element sets describing each object's orbital parameters — is published publicly by SatNOGS from NORAD tracking. I pull those and run them through SGP4 orbital mechanics in the browser. Real-time positions for the ISS, Starlink constellations, weather satellites. Each one renders with its predicted orbital path extending ahead of its current position.
The reconnaissance constellations are in there. Not labeled as such, but the orbital signatures are distinctive — sun-synchronous, low-Earth, optimized for ground coverage. You can watch those passes line up over any point on Earth. Click any satellite, the camera locks and follows the orbit.
I sat there for a while just doing that.
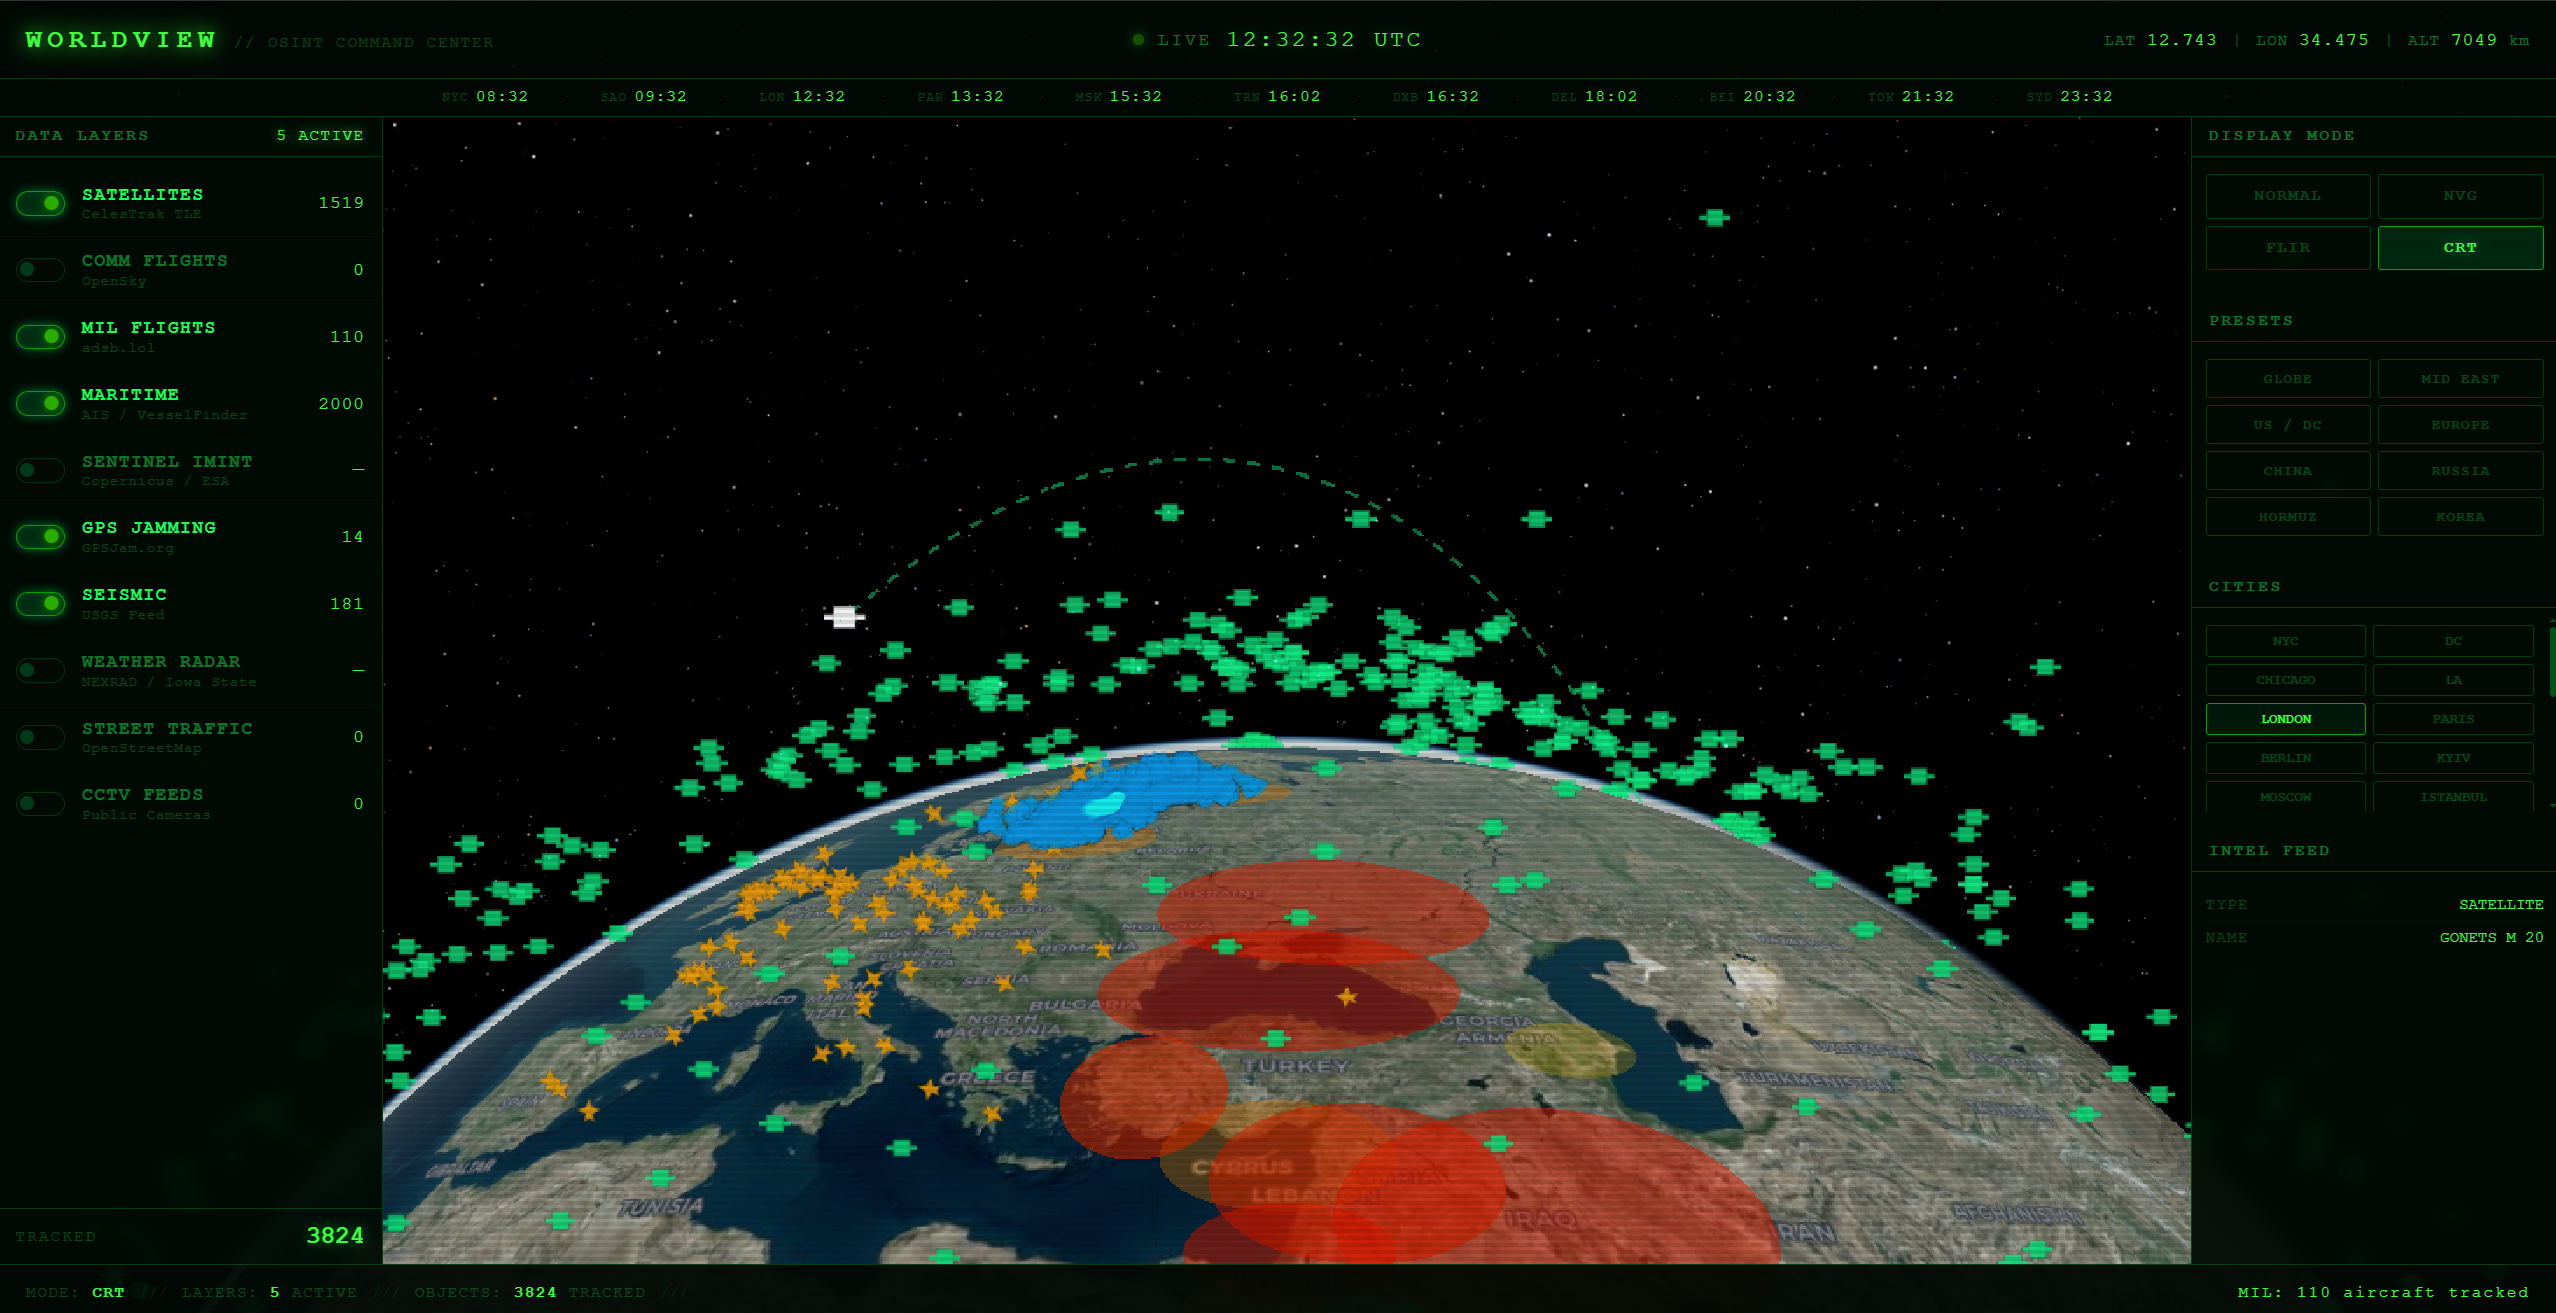
Camera locked to a tracked object — orbital path extending forward, entire constellation visible in low-Earth orbit
The GPS jamming layer is the one that stays with you
Every commercial aircraft is an involuntary sensor for electronic warfare.
They broadcast GPS confidence levels as part of normal ADS-B telemetry — it's just operational data the plane is emitting anyway. When enough planes in the same region report degraded navigation, that pattern is not random noise. That's active interference. GPSJam.org aggregates those reports. I pull it and render it on the globe.
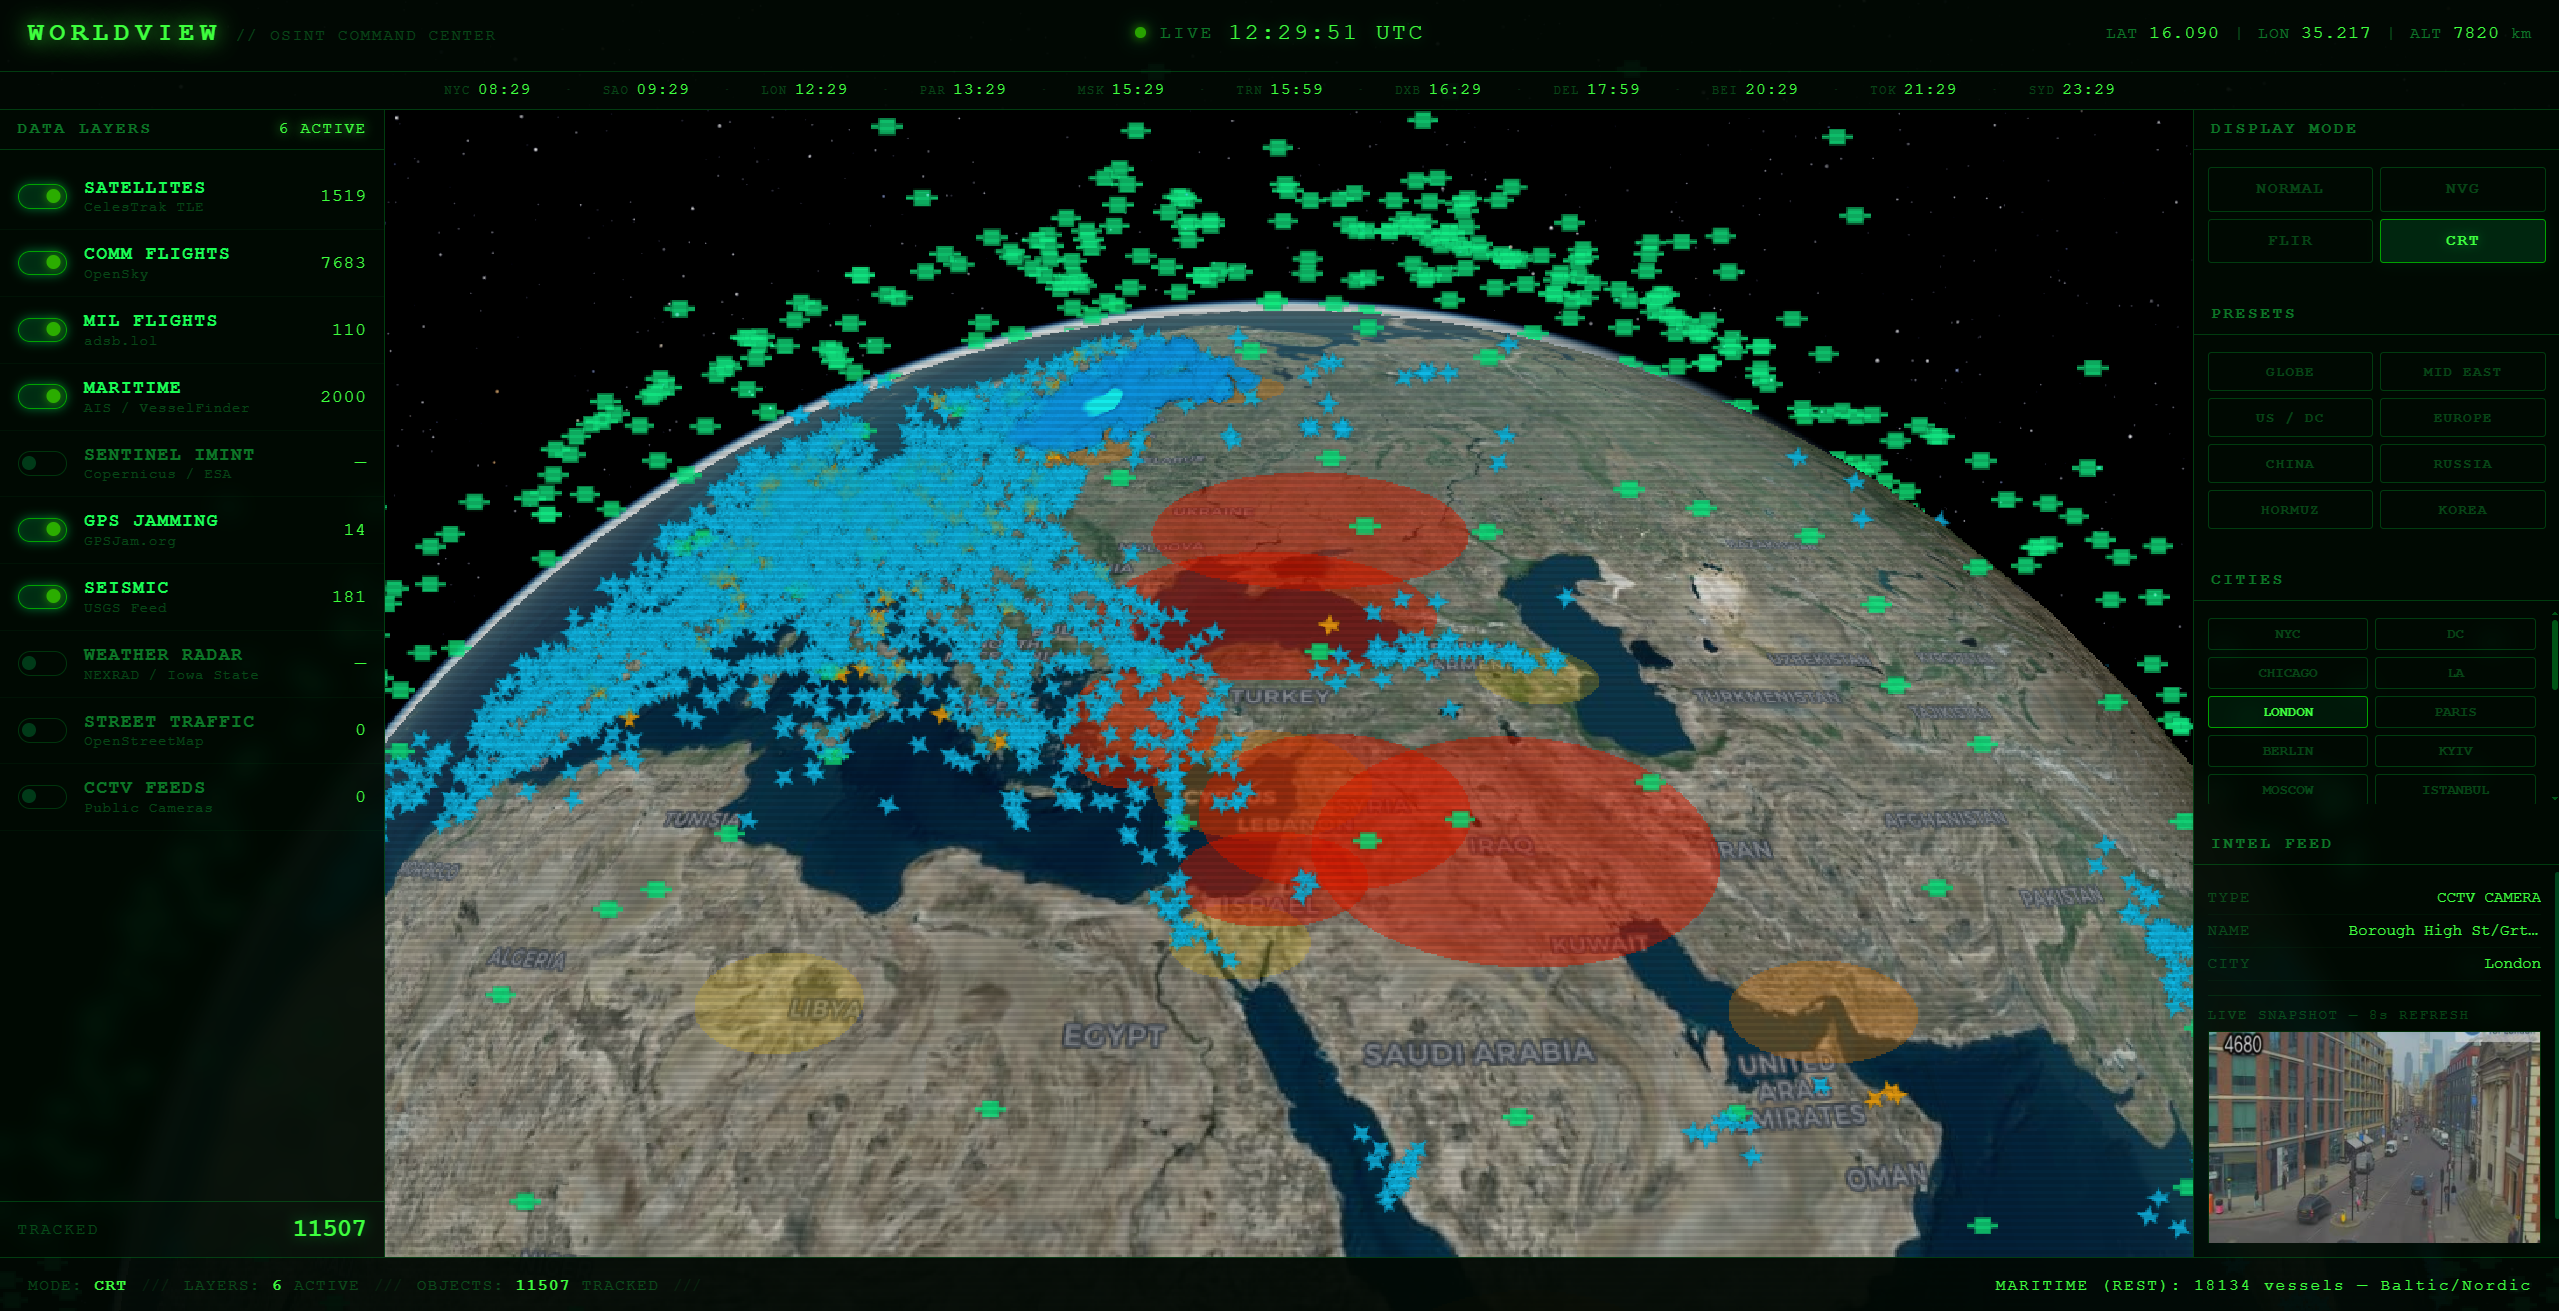
GPS jamming heatmap — active electronic warfare zones derived entirely from civilian ADS-B telemetry
I'm not inferring this from news reports. I'm reading it directly from civilian aviation data that anyone can access. That's what OSINT is at its best — not accessing restricted information, but combining unrestricted information until the picture it forms starts feeling like it shouldn't be this easy to see.
Then there's the ground layer
At some point I zoomed into London and pulled up city feeds. The satellite view was still active — I was looking at the city from orbit. Then I switched on the feed layer and the screen filled with green.
Hundreds of live camera feeds, each one plotted at its coordinates, connection lines radiating back toward the city center. Not imagery. Not signals. Street level. The same block you were just looking at from 400 miles up, now visible from a camera bolted to a lamppost. All public. All open. All just sitting there.
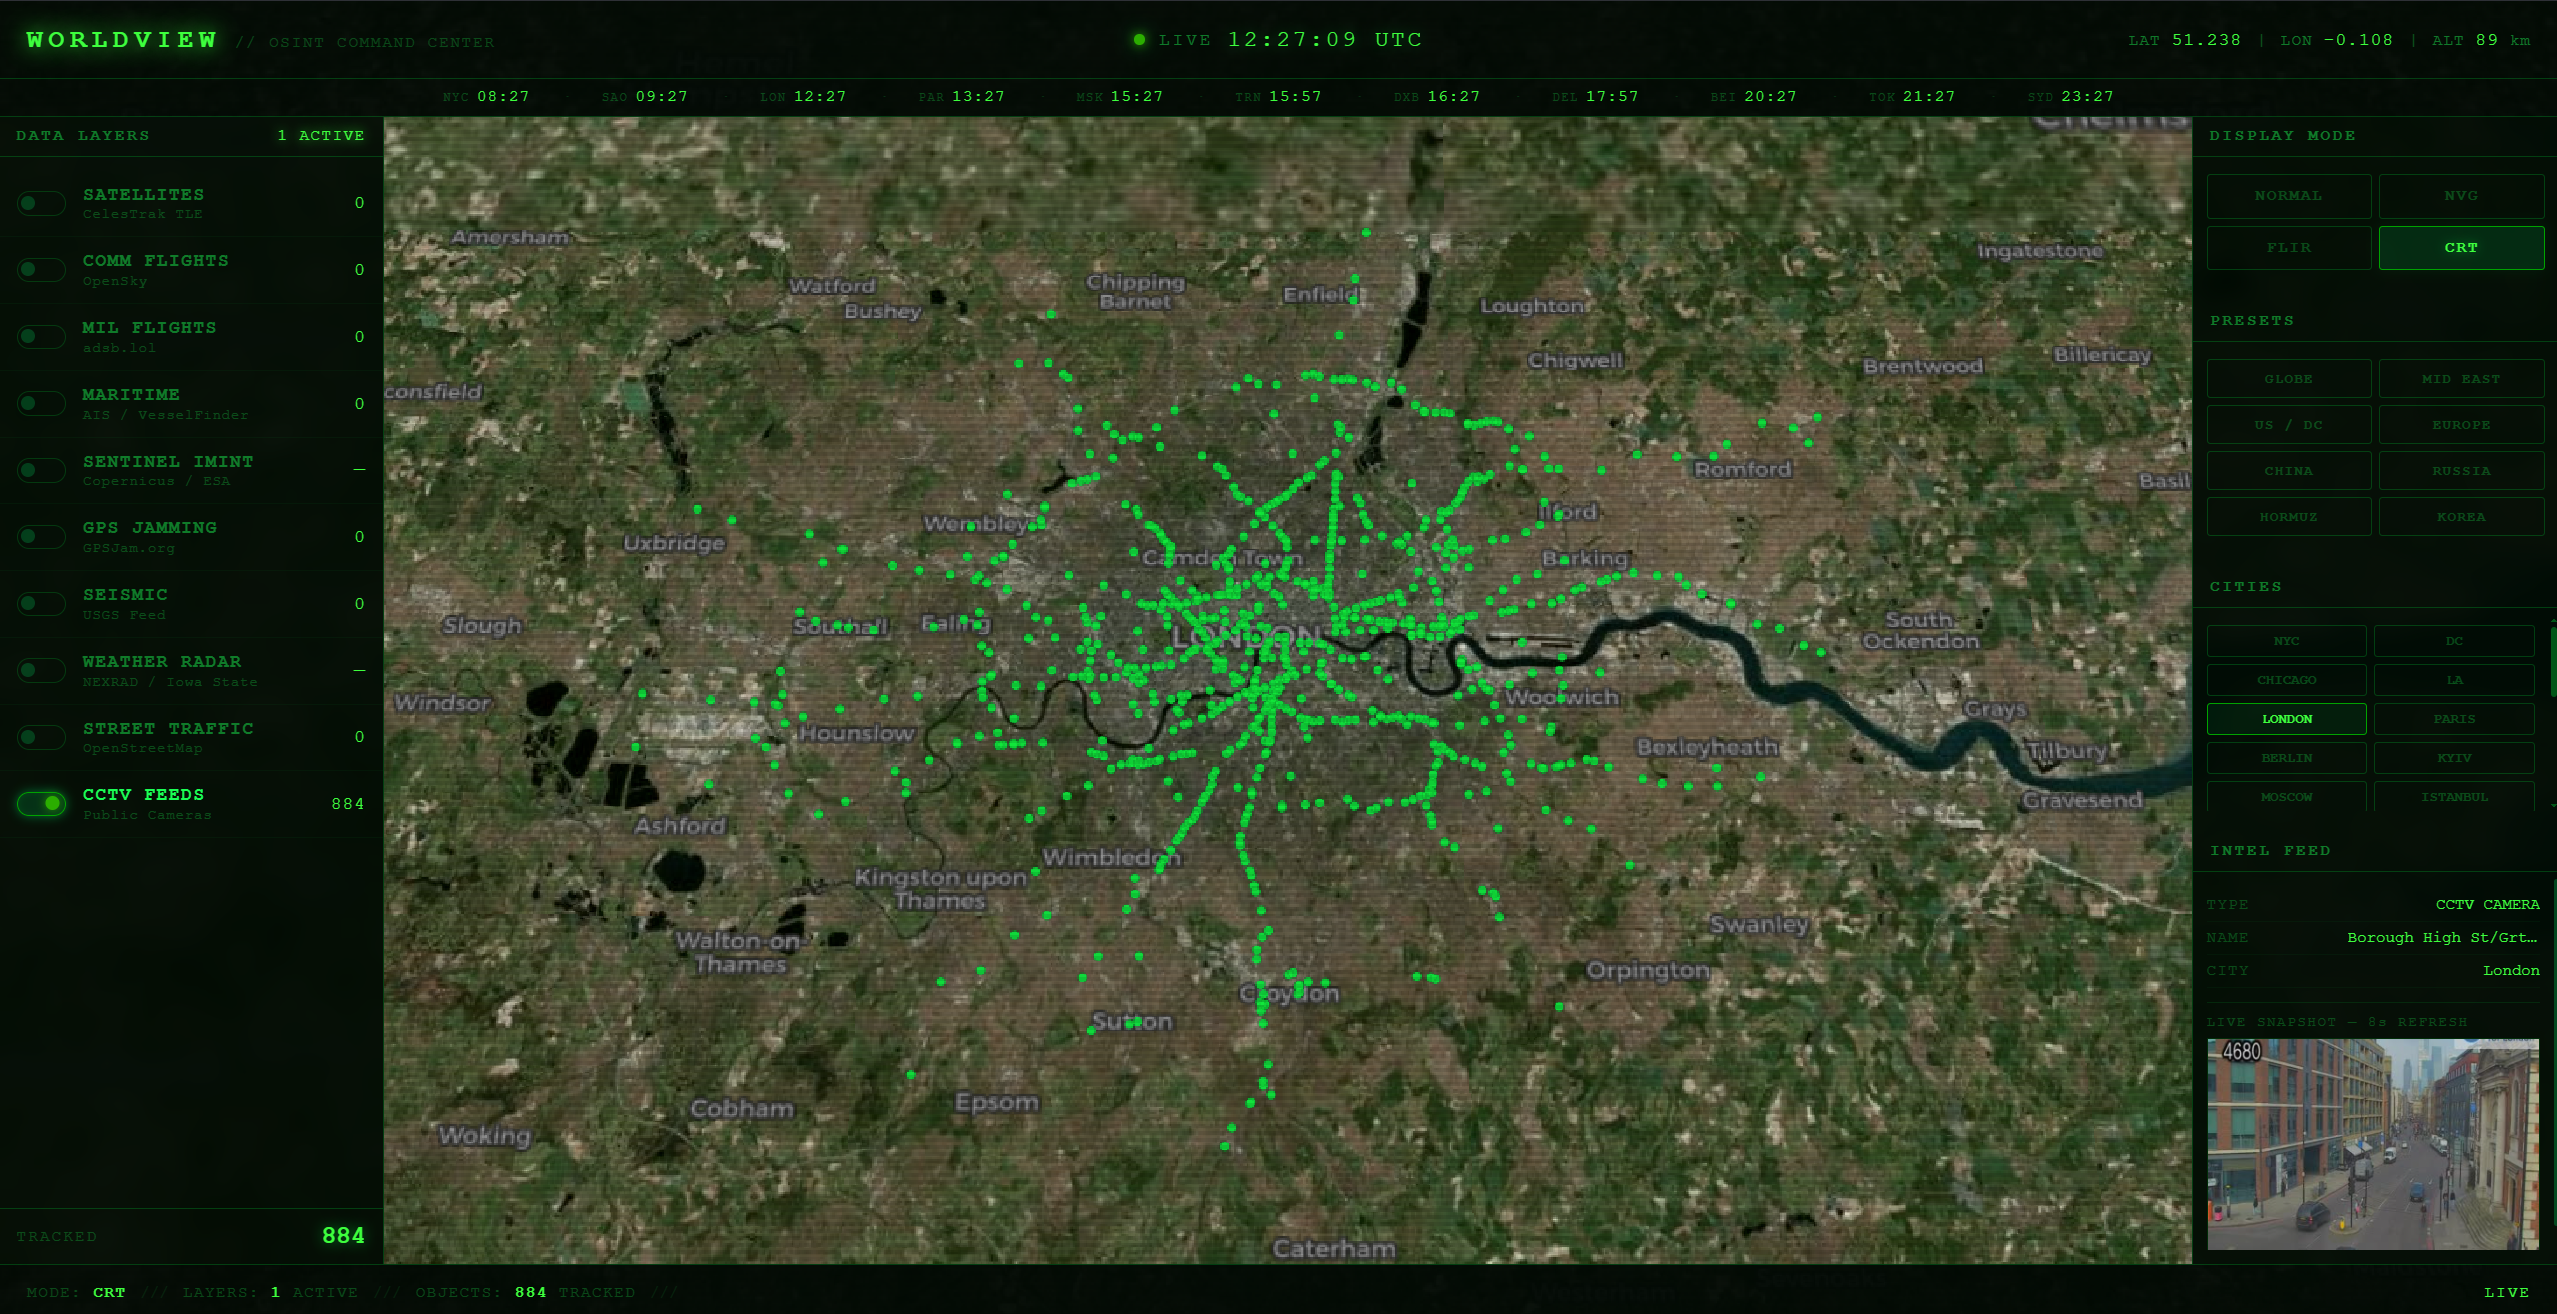
London city feeds layer — public camera network plotted at ground coordinates, overlaid on satellite imagery
That's the moment the altitude thing stops being abstract. You have orbital mechanics running in the same tab as street-level surveillance camera feeds. The vertical stack goes from 550km down to eye level. One browser. One globe.
One person. Free APIs. Claude Code.
I want to be specific about how this was built because I think it's the part that actually matters.
I used Claude Code as the development environment for all of it. Not by describing features and having AI spit out a codebase — by having a collaborator that could hold the full architecture in context while I worked layer by layer. Each data source is a self-contained module. The click handler, the label system, the orbital mechanics, the camera tracking — built incrementally, nothing breaking what came before.
What that compressed is real. Building a geospatial intelligence dashboard that fuses seven live data sources, runs orbital mechanics in the browser, and tracks entities across all of them used to require a GIS engineer, a backend developer, and weeks of integration work at minimum. This was focused solo sessions.
I have no institutional background in geospatial systems or intelligence. I built this from a desk. The build is the argument.
What it actually means
The government has sensor systems that can read a license plate from orbit. I have NORAD's public catalog and some API calls. I'm not claiming parity.
But the analysis layer — the tools to fuse, visualize, and reason over spatial data — those have been commoditized. And the infrastructure to build on top of that is now accessible to one person with a laptop and an AI coding environment.
The physical world is becoming as queryable as text. That's not a metaphor. It's what WorldView is demonstrating on a small scale — public data, fused together, producing a picture of what's actually happening anywhere on Earth, updated in real time, running in a browser tab.
This is the prototype. The full build is on YouTube.
Watch the Full Build Walkthrough
Every layer, every architectural decision, and the full Claude Code development workflow — documented on YouTube.
Watch on YouTube More articles →